Introducing the Darkroom Histogram
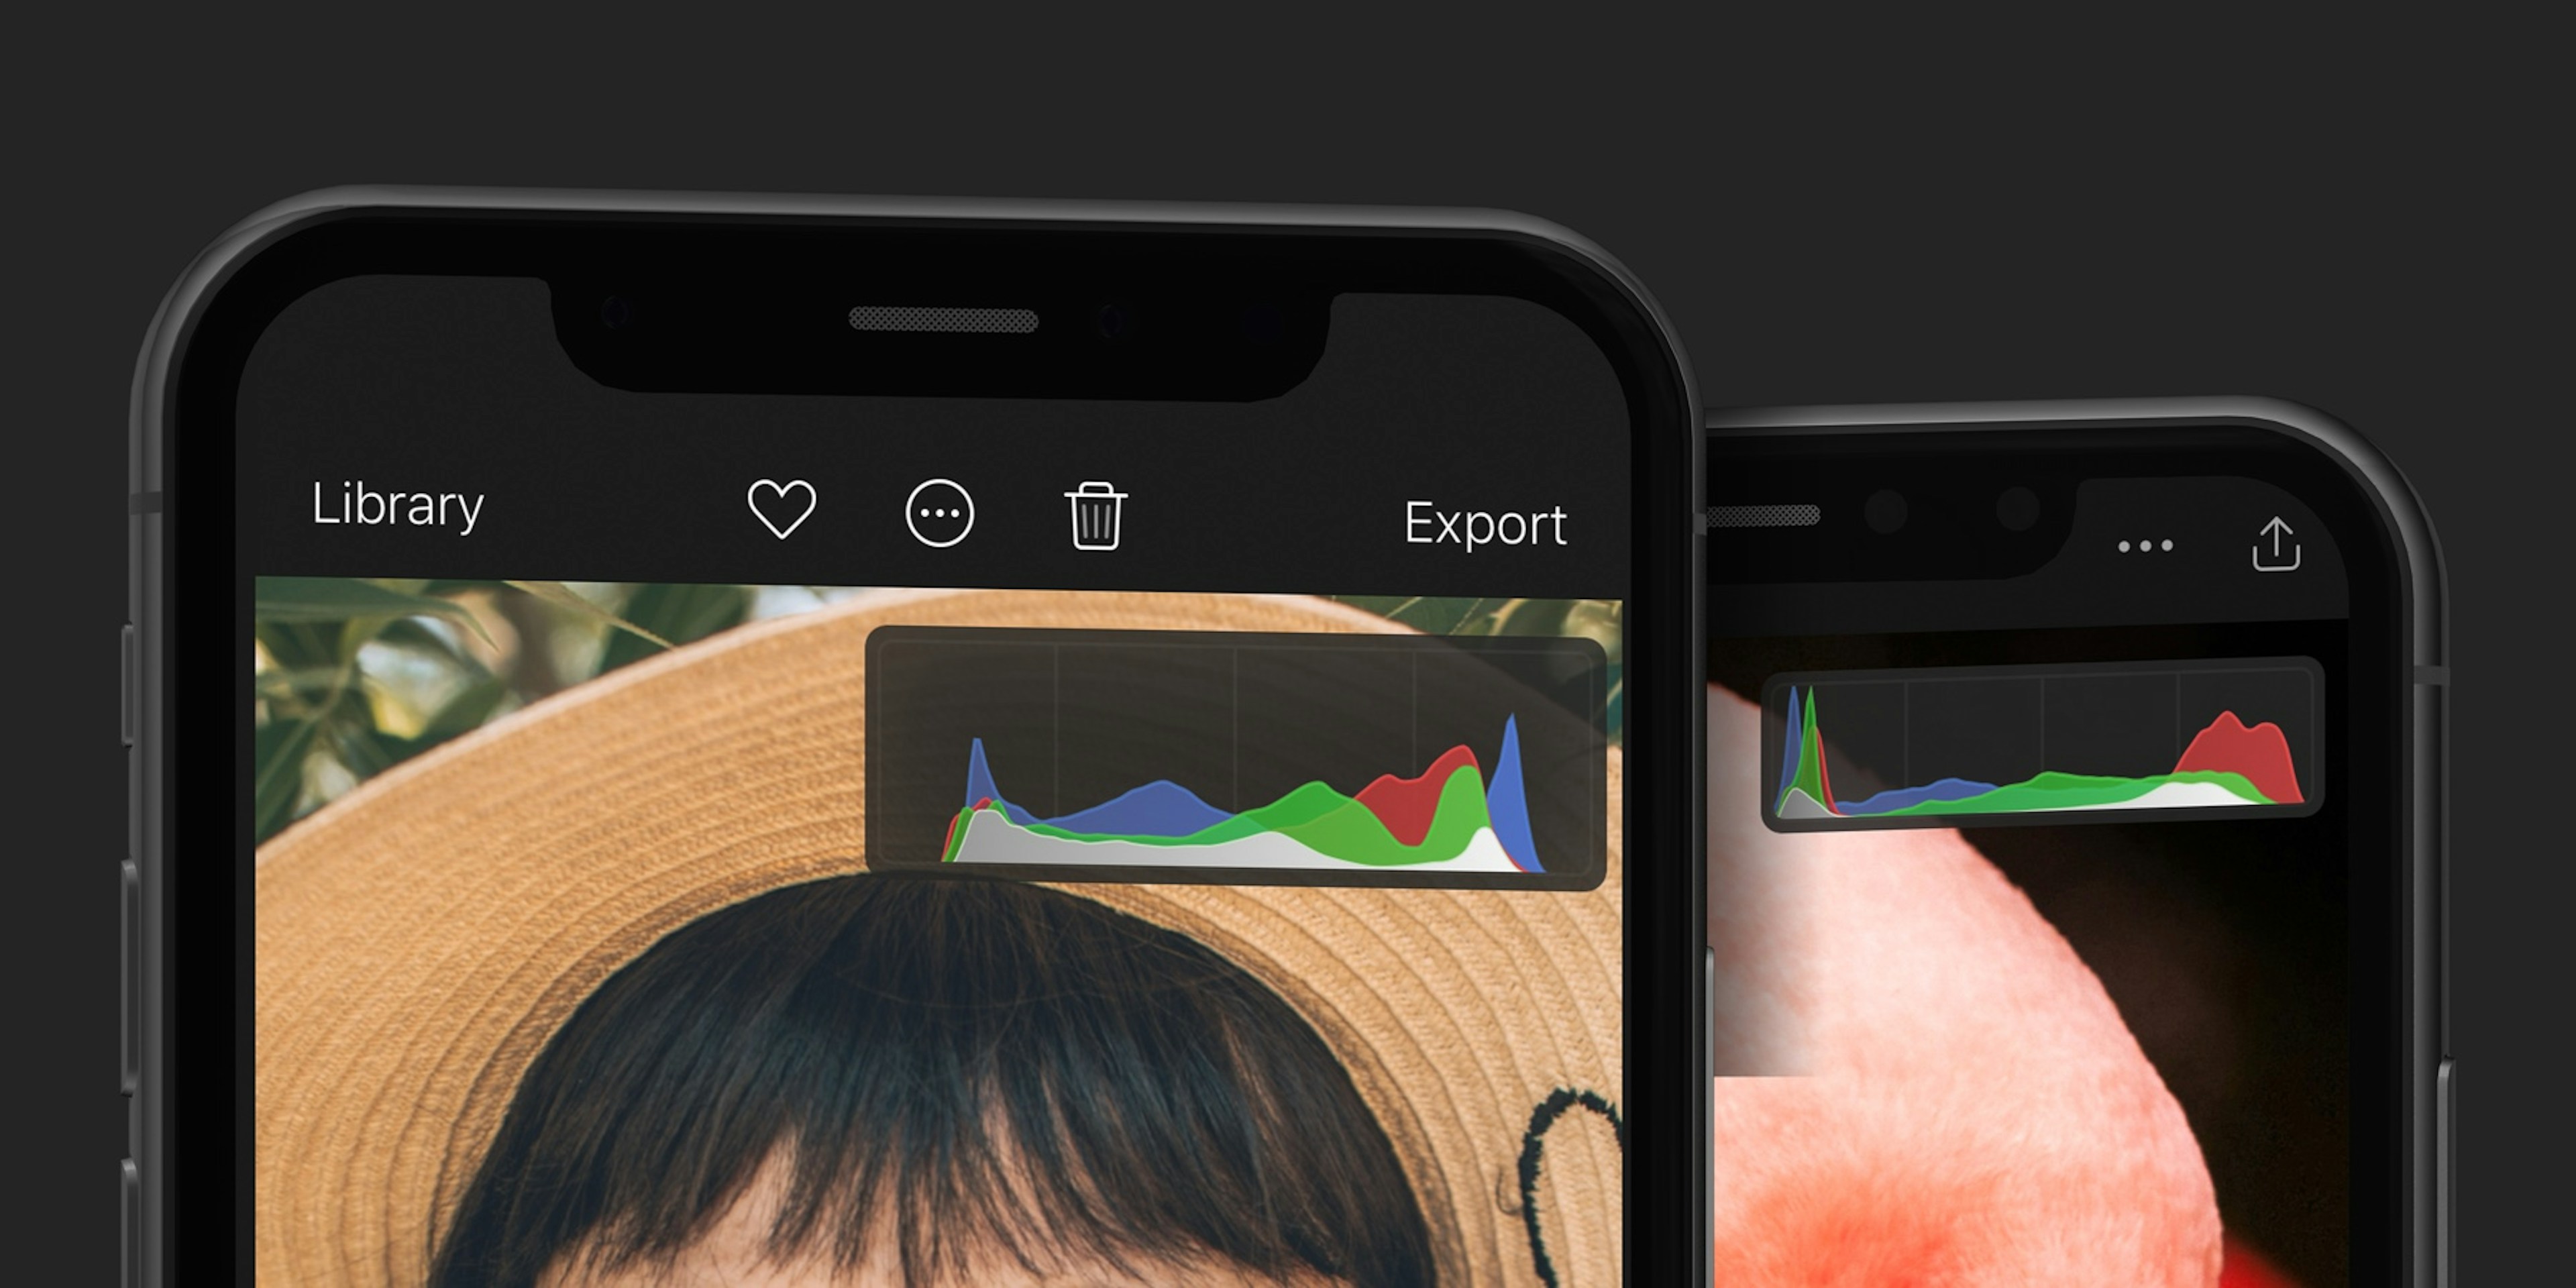
The Darkroom Histogram is finally here in all its colorful, curvy glory! We obsessed over these little curves to create a histogram that was easy to use, and that goes beyond just a graph of numbers.
Our primary innovation here are the rich, verbose clipping indicators. Instead of abstract shapes that have no meaning, we show you contextual words that guide you through the histogram-driven editing process. We spent a lot of time making sure you see the right thing, at the right time, and in the right context.
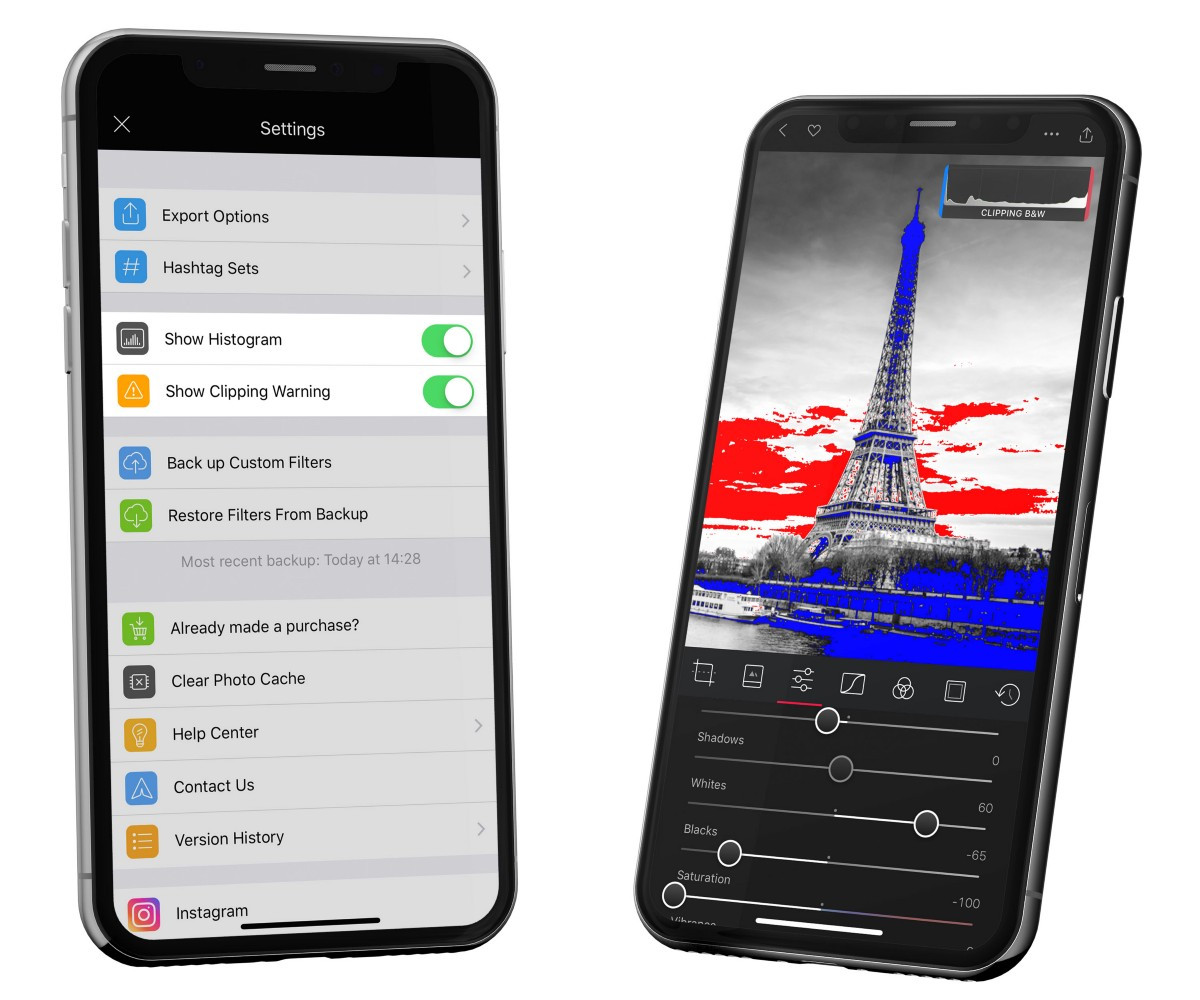
To access the photo histogram either tap the (…) action menu when viewing a photo and selecting Show Histogram, or head to Settings in the app. To hide it quickly, you can just swipe it offscreen to the right.
Ok great, but like, why?
Histograms help you more easily spot and fix problems with your photos objectively, in a way that eye-sight alone isn’t suited for. More specifically, histograms help you fix exposure and color problems in your image. Let’s talk about what a histogram shows you, so we can figure out how it helps you do those things.
A histogram is a diagram of how the pixels in your image are distributed. It goes from zero to one, left to right. During an editing session, we analyze the image and calculate how much of the image is 0% white, 1% white, 2% white, all the way to pure white. We do this for the three color channels as well: Red, Green, and Blue. We then plot those points to generate the final graph you see above your photo.
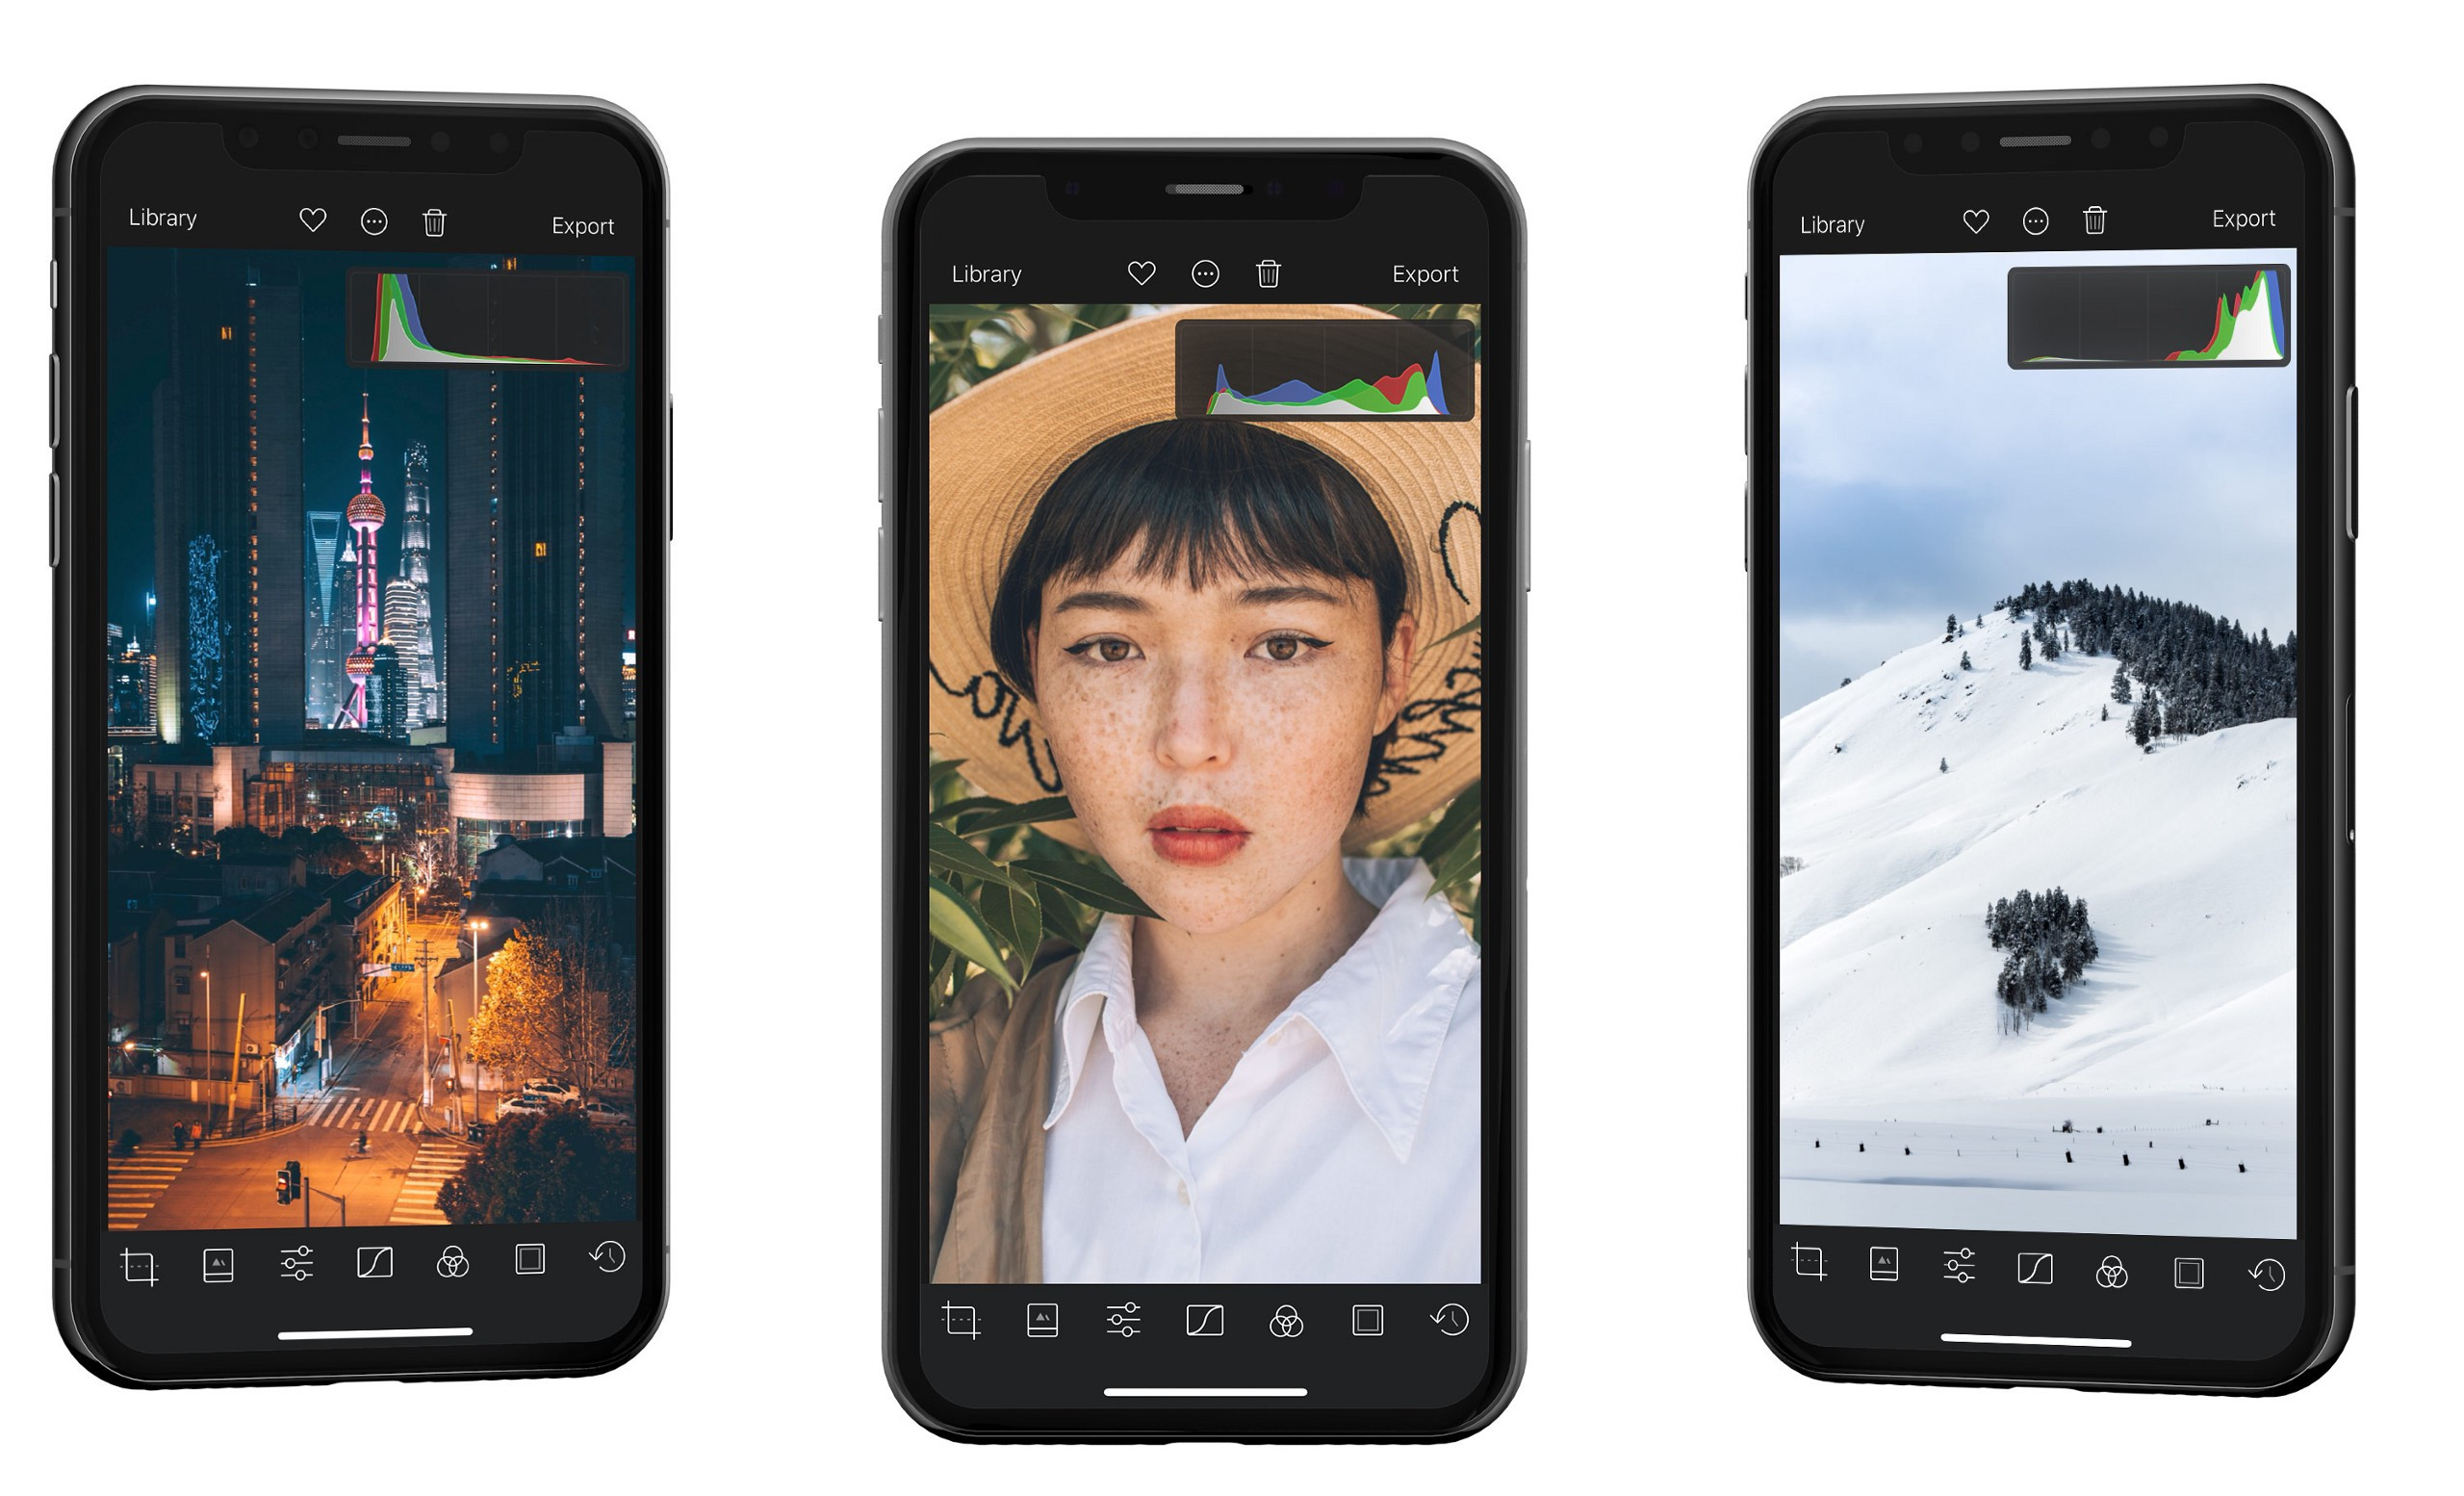
The three photos below shows different histogram shapes for different exposures. A dark photo will have a histogram that’s heavy on the left side. A bright photo will be heavy on the right side. And most of your photos will have a center weighted histogram like the one in the middle below.
Perfect Exposure, Every Time
Your iPhone will generally try to expose photos such that they use the full tonal range. However, there are many situations in which the camera will struggle. For example, if the sun is casting a glare on your photo, or you capture an image through a window, your photo may appear flat. You could eye-ball the fix, but due to screen brightness, features like True Tone, and ambient light, it can be very hard to know conclusively when you’re hit pure black/pure white. This is where a histogram shines. If your photo does not have any pixels in the pure-white bucket, the graph will be zero.
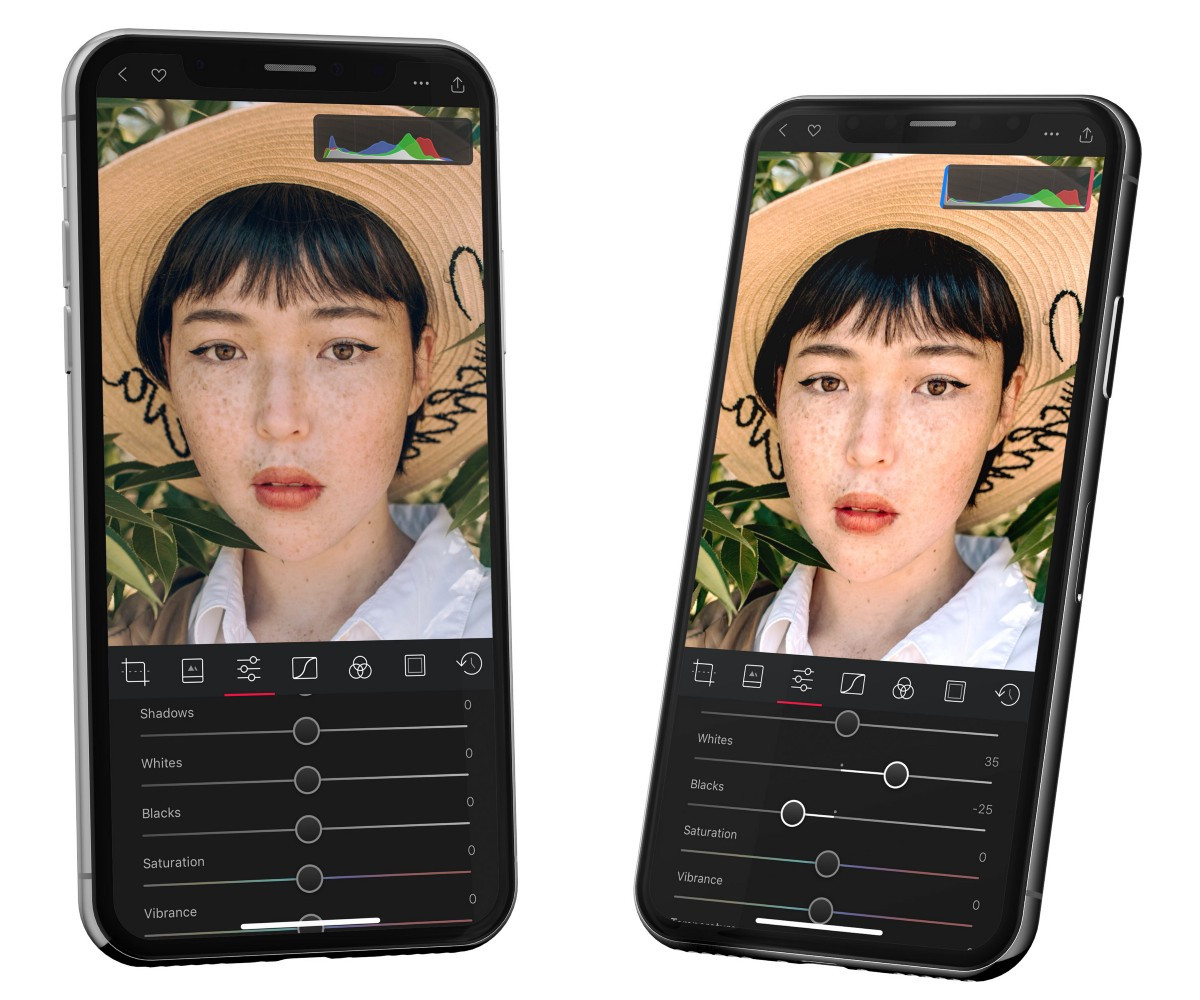
Here’s an example. Notice how the white portion of the histogram on the left doesn’t extend all the way to the edges. By adjusting the white and black sliders, we can stretch the histogram so that it takes advantage of the full tonal range, and you get a much richer image as a result. Many professional photographers do this as their first step in the editing process.
Color
The Histogram also contains color information. This helps you spot color casts and white balance problems in your photo. Just like with exposure, your iPhone will try its best to capture the photo with the correct white balance settings, but it can’t always do that reliably.
Fixing color casts requires a bit more finesse. Here’s the thing to remember: When the red, green, and blue channels overlap in a region, that region no longer contains any color (When the three channels are equal, you get gray). However, if you want a certain region to be gray, and it is not, then the histogram can tell you what to do.
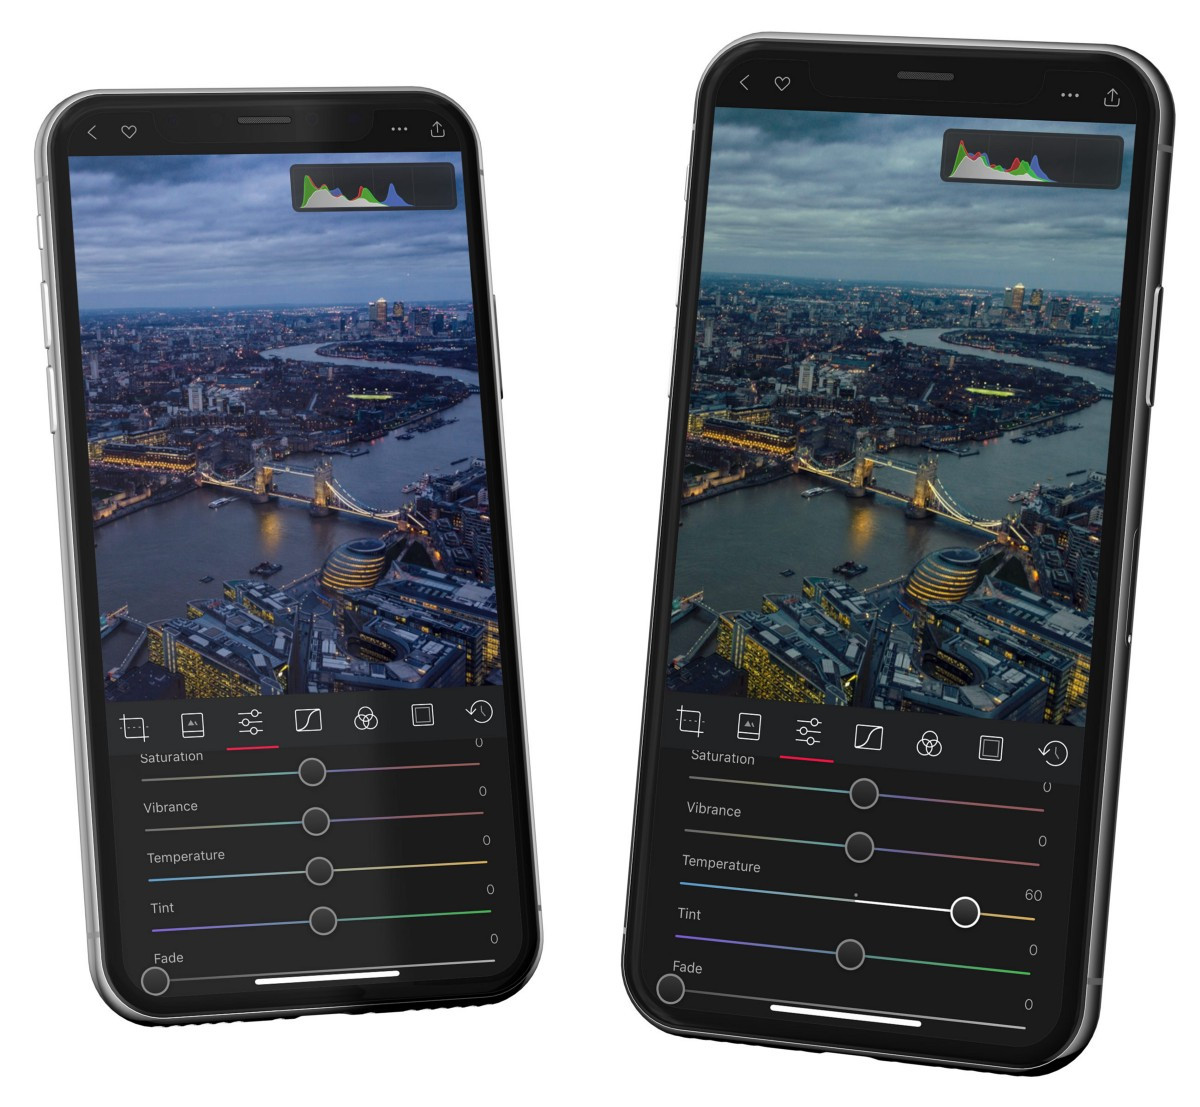
In the example below, the whole image has a green/blue tint to it because of the tinted windows it was shot through, and the time of day. This is confirmed by the histogram: Notice how much more blue and green there is in the highlights. By adjusting the tint, we can align the blue and green channels, and by adjusting the temperature and or curves, we can align the green and blue channel with them.
Clipping
Clipping refers to data that is pushed out of range. Color information generally lives along a spectrum from 0 to 1. However, photo editing allows you to manipulate your data. If you make an image too bright, or too dark, you might push white or black too far, and all that data can be lost, or clipped.
We generally do our best to guard you from clipping information from your photo. But with tools like the Blacks and Whites, Curves, or Vignette, it’s not that hard to clip. Without a histogram it’s rather difficult to see pure black and pure white and know with certainty that you have lost details while editing. A histogram makes it easier to spot. When you see a peak on either the left (black) or right (white) sides you are running a risk of clipping.
When you have the histogram visible, we will explicitly indicate in the histogram when you are clipping blacks, whites, or color. We do so with indicators at either side of the histogram, and briefly with a short text message below. We also show you those clipped pixels highlighted by clearly marking them on top of your photo with pure white pixels in red, and pure black pixels in blue.
Note: clipping warnings do not show unless you have the histogram shown. We have made it possible to turn off clipping warnings in settings.
Blacks & Whites Tools — Free
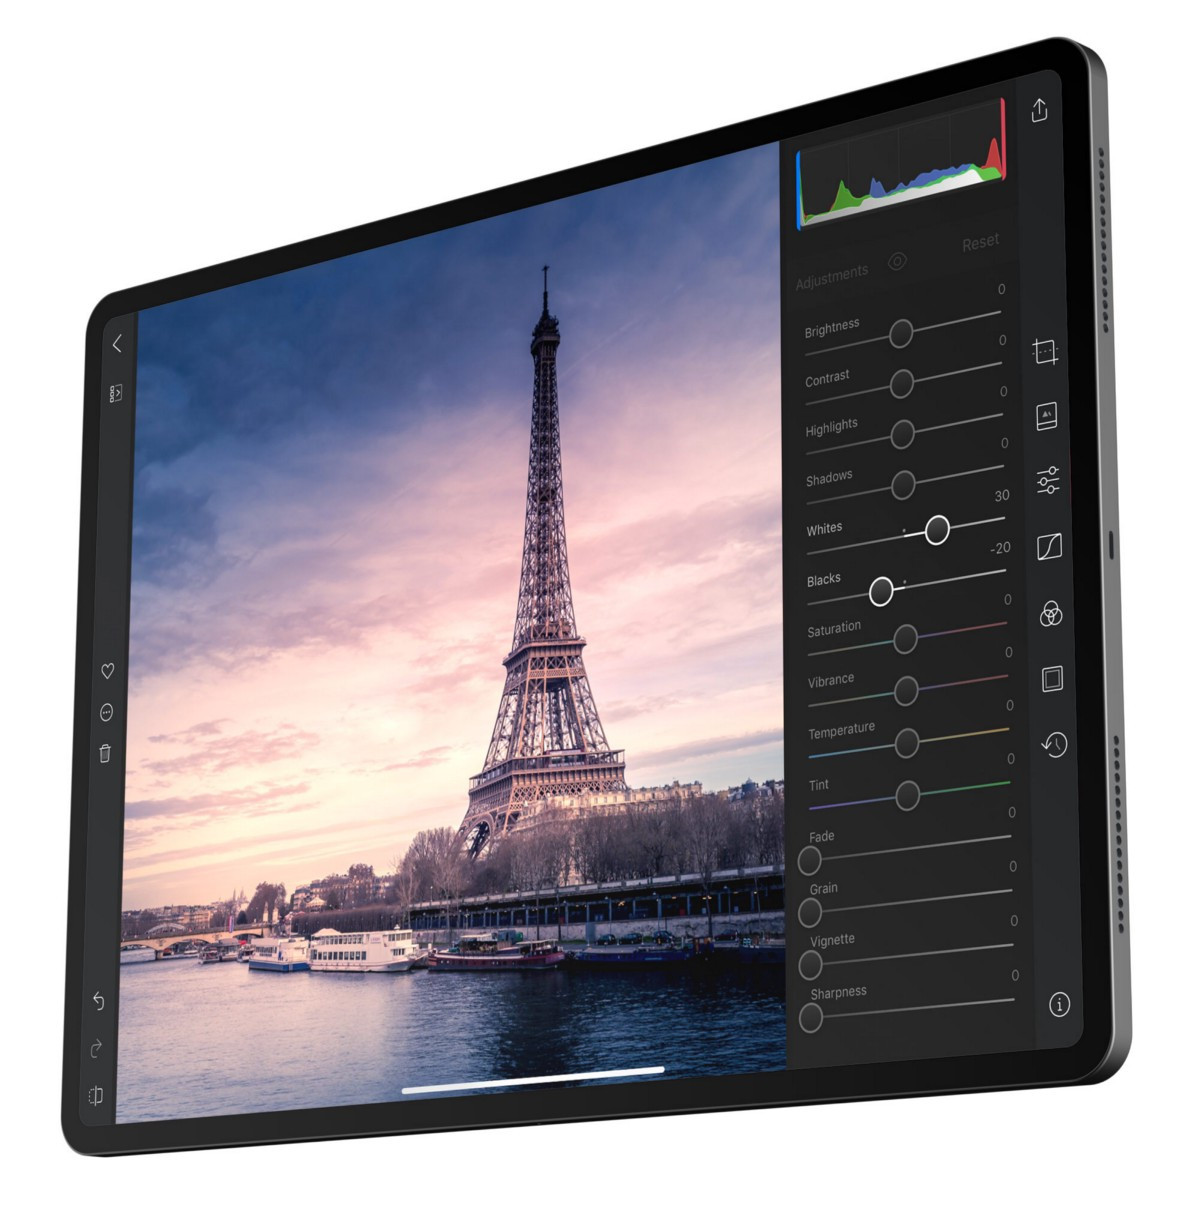
We are sure you have had shots that looked a tad flat and washed out, with a lack of true white or black. Most images look best when they utilize the full range dark to light which can be displayed on your screen or in a print. This is the tool that makes it possible for you to stretch your darks towards true black, and your lights towards true white. When considering adjusting your blacks and whites, ask yourself: is there any region in the image which should be completely black or white, and does the image histogram show this?
Tip: by stretching the range of your photo a lot you are increasing the likelihood of posterization happening. The posterization effect ranges from subtle to quite pronounced which looks like color bands or steps where you’d expect a smooth gradient. In your histogram you’ll spot posterization pretty easily as well in the shape of jagged edges instead of smooth curves. In your photo you will notice it the most in blue skies, and can counter act it a bit by adding Grain.
Curves
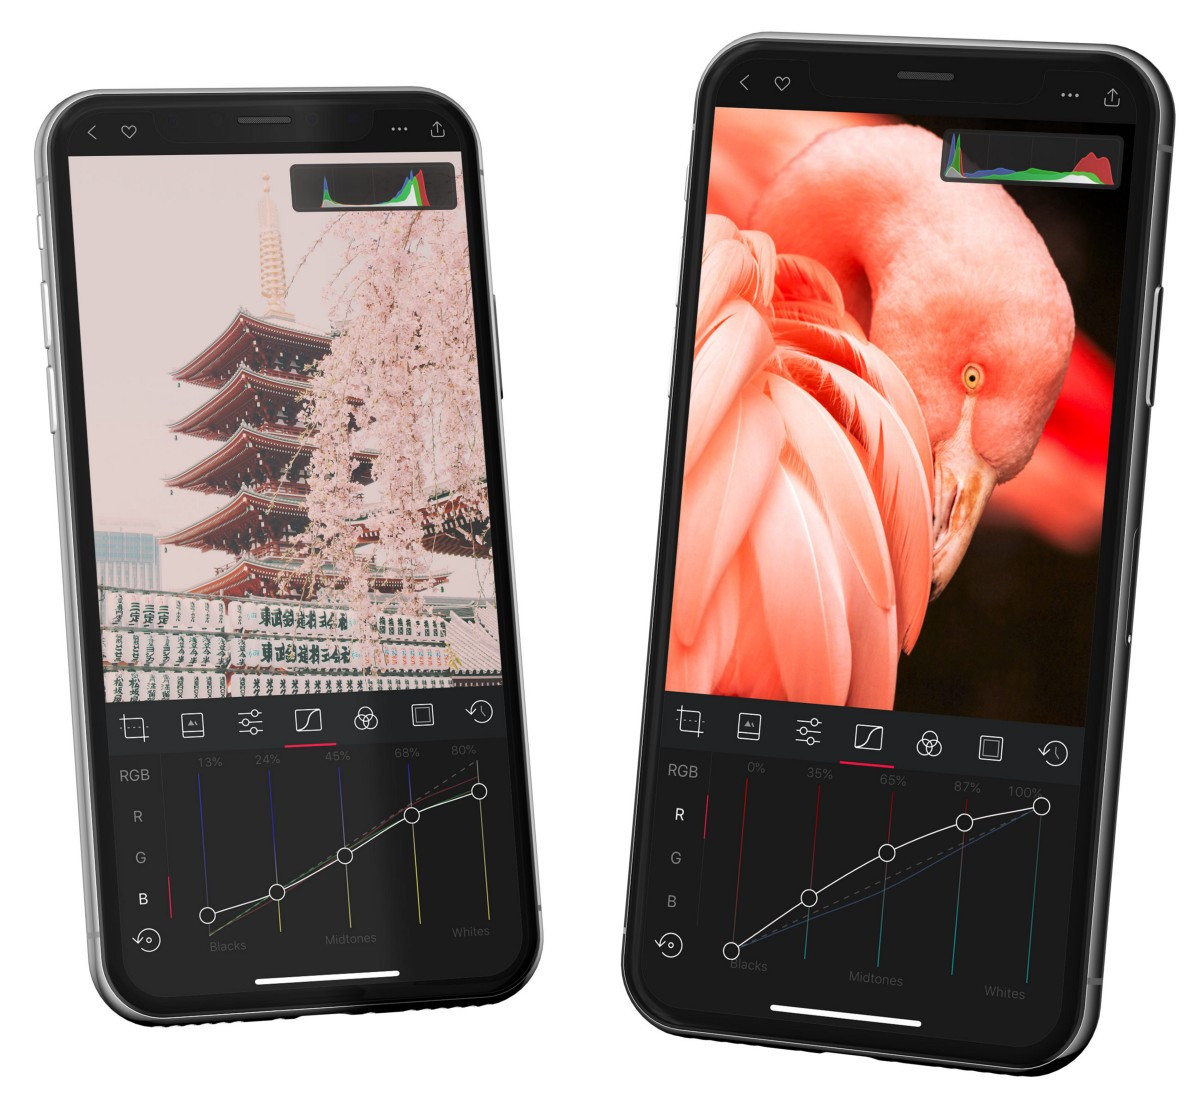
Any time we think we can improve on the usability of the curves tool we grab it with both hands. In this iteration we now show you the curves of all edited channels in each channel. This means less switching to see or match what edits you had made in any of your other channels. Which makes for a subtle but powerful workflow improvement.
App-Wide Refinements
We’ve also taken a hard look across the app and added improvements throughout. For a full list of changes, please refer to our updates page.
As a final note, a huge Thank You to our most recent addition to the team Igor, for building much of this release and keeping on iterating. It would not have happened without you!
The Darkroom Team
